
Comparison question: When does a crypto protocol’s buyback create a meaningful link between business revenue and its token—and when might that link be weakened by new supply, market conditions or how the purchased tokens are used?
This article draws on an analysis by WallStreetBets, compiled in Chinese by Deep Tide TechFlow and published November 13, 2026, at 16:37:59 UTC+08:00. Its figures and examples reflect that reporting period, not current conditions.
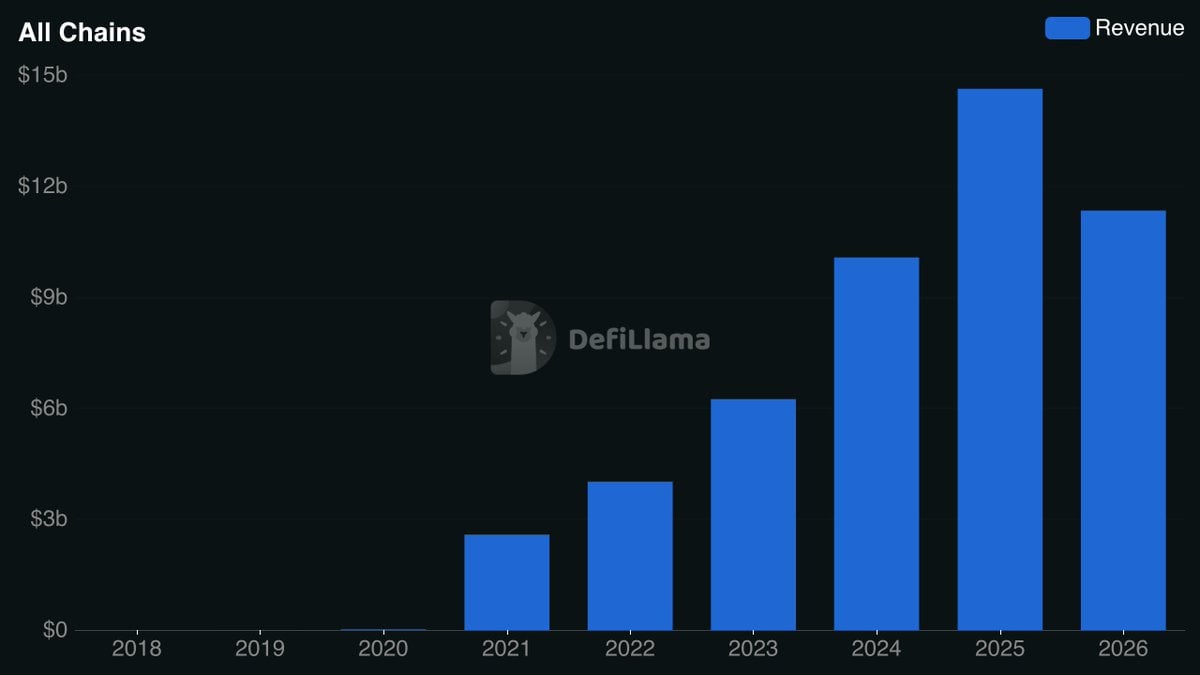
Revenue and token value are different things
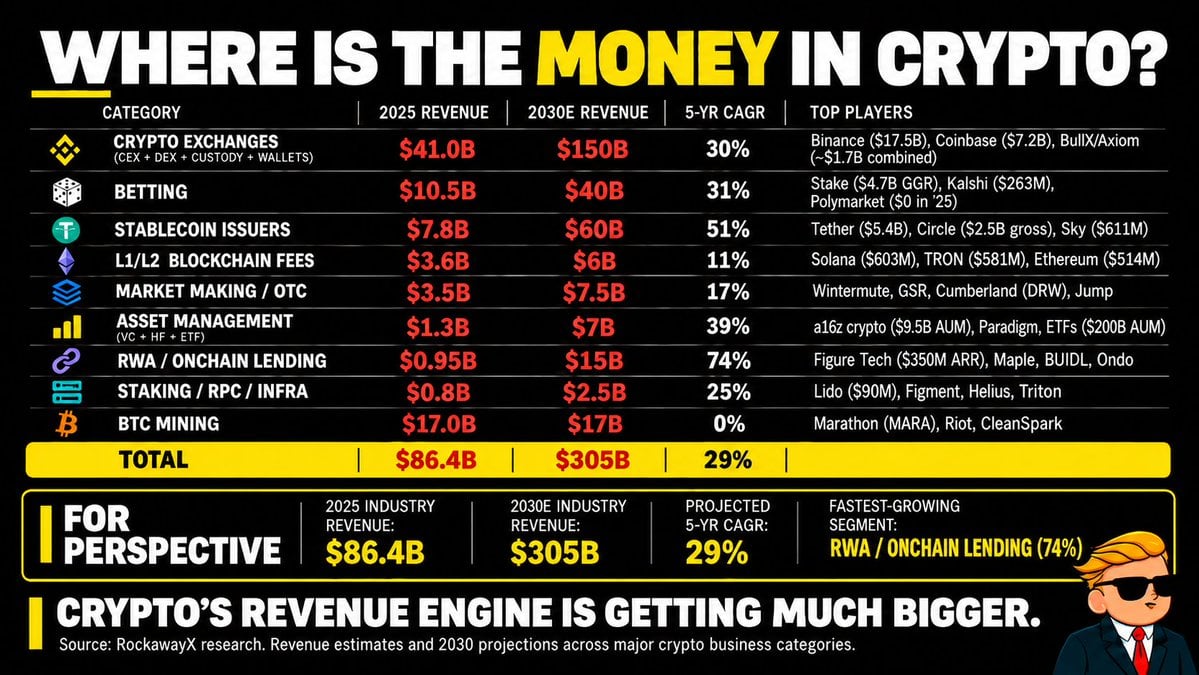
The source reported $11.68 billion in year-to-date on-chain protocol revenue in 2026. It projected roughly $13.9 billion for the full year if November and December remained near October’s level. Revenue, however, does not automatically accrue to token holders: most crypto tokens do not give their holders legal ownership of a company or its profits.
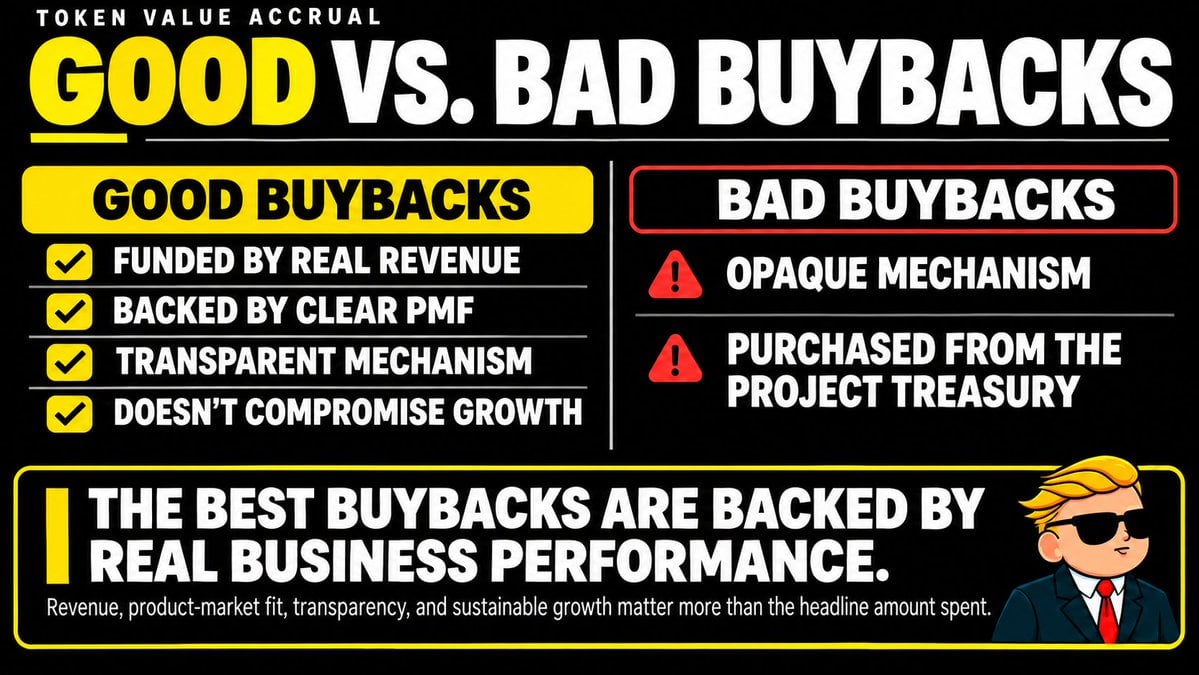
A protocol can use part of its revenue to purchase tokens on the open market. It may then burn them, lock them or place them in a treasury. Those outcomes are not interchangeable. A burn removes purchased tokens from supply; a treasury transfer does not necessarily do so. Nor does a buyback guarantee a higher price.
For a like-for-like assessment, the source proposes checking four things: whether purchases are funded by genuine business revenue rather than depleted reserves; whether recurring demand supports that spending; whether holders can verify the funding, execution and destination of purchased tokens; and whether the spending leaves enough capital for growth and financial resilience. Two further comparisons matter: how much new supply enters circulation through unlocks or emissions, and what market conditions prevail during the purchases.
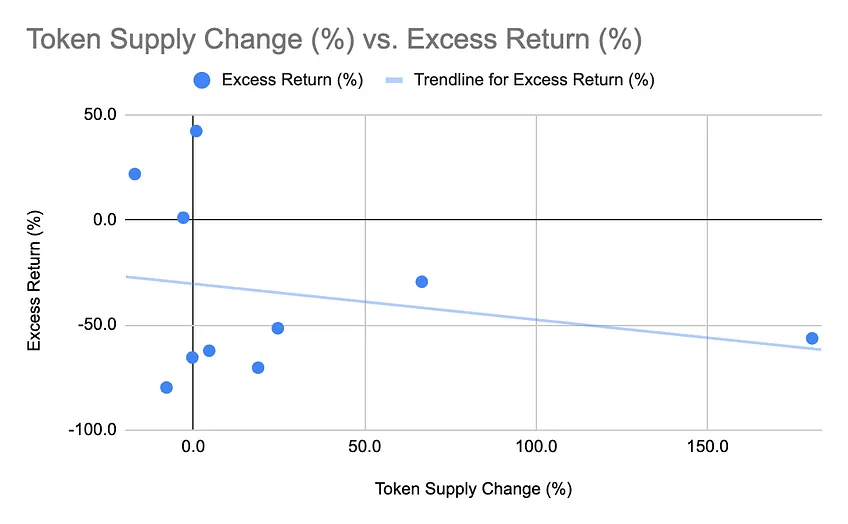
What the reported performance does—and does not—show
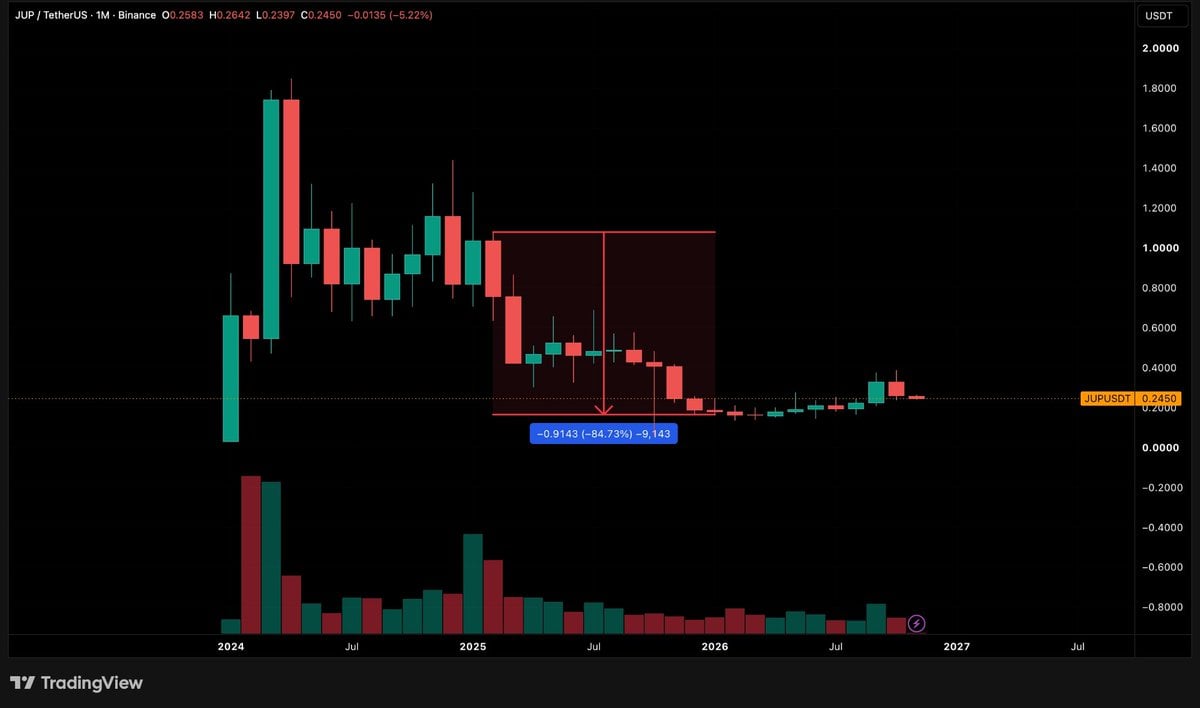
In 2025, 28 major projects spent more than $1.4 billion on buybacks, according to the analysis. Only three of that year’s ten largest buyback projects—AAVE, HYPE and SKY—outperformed Bitcoin. Jupiter illustrates why spending alone is an incomplete measure: it began allocating 50% of on-chain protocol revenue to JUP buybacks in February 2025 and had spent more than $70 million by January 2026, yet JUP’s price had fallen substantially. The author points to the broader Solana-market decline as important context, rather than treating the price change as a clean test of buybacks.
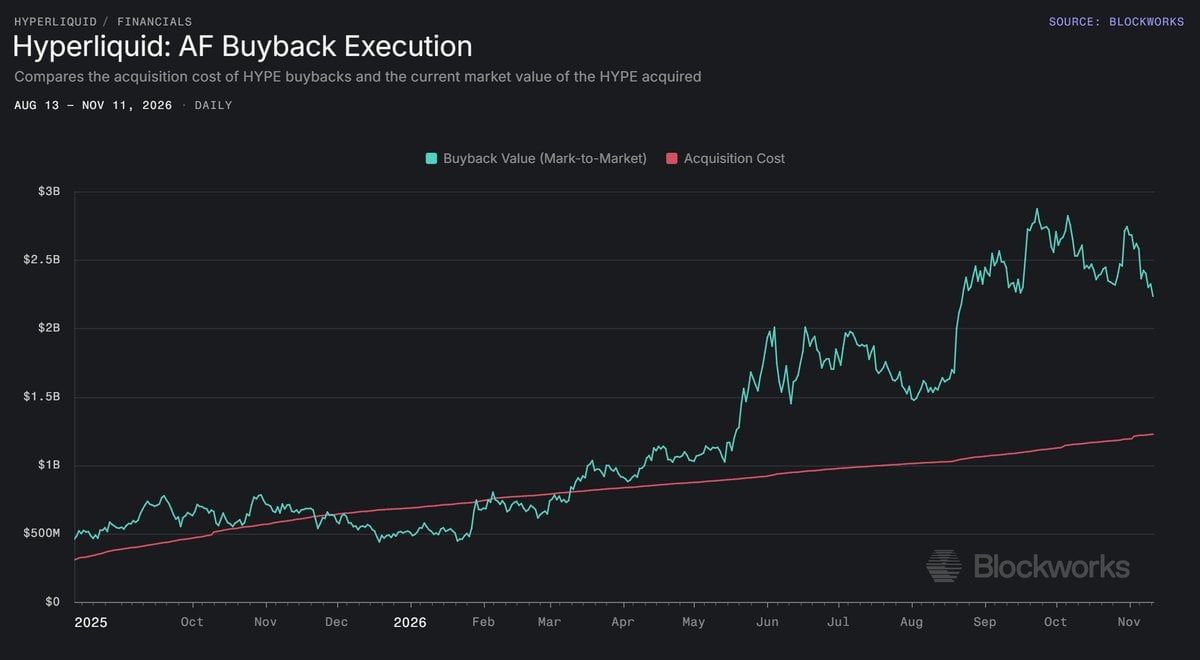
The source reported more than $900 million spent on token buybacks and related burns in 2026 through its reporting period, led by Hyperliquid at more than $505 million and Pump.fun at more than $269 million. In a separate sample of the 30 protocols with the highest revenue over the preceding 30 days, 14 had no publicly tradable native token. Of the remaining 16, 12 had active buybacks: nine showed positive year-to-date token returns and three negative returns, with an average of +62.2% and a median of +32.6%. Among four without active buybacks, one was positive and three negative; their average was −31.6% and median −31.5%.
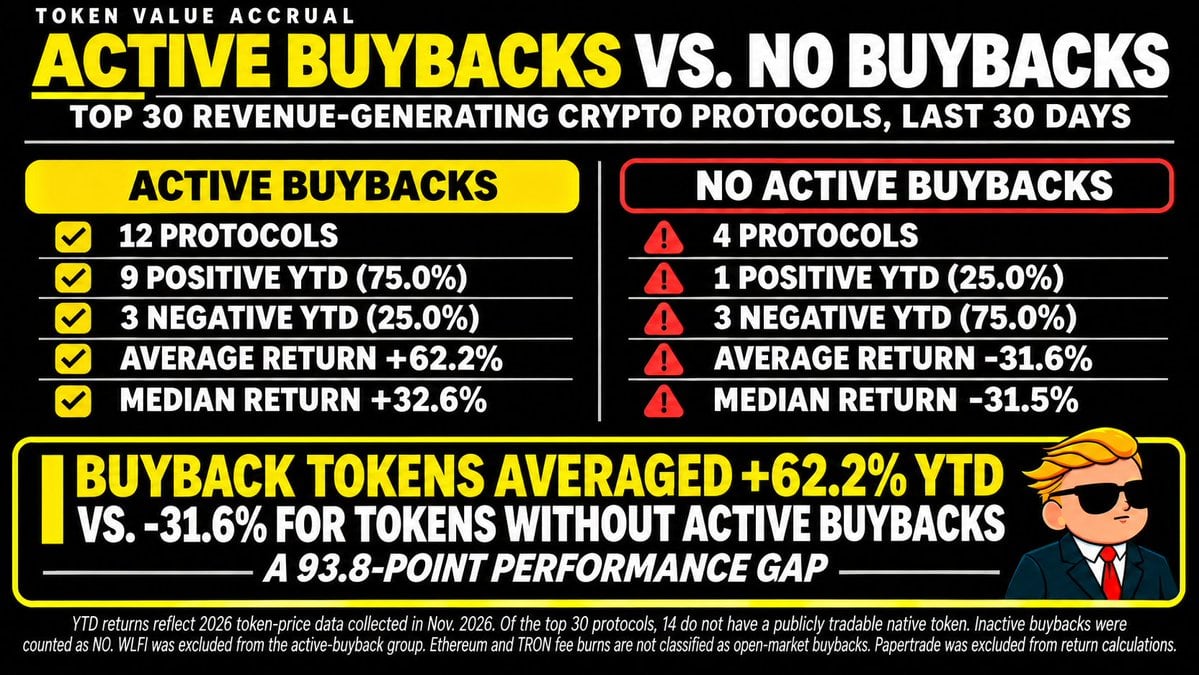
Those are observed groups, not evidence that buybacks caused the difference. The source says returns used token-price data collected in November 2026. Its non-buyback group included discontinued programs; it excluded World Liberty Financial because its program had only recently started, did not count Ethereum or Tron’s automatic fee burns as open-market buybacks, and excluded Papertrade because its token launched in October 2026 and lacked regular spot trading.
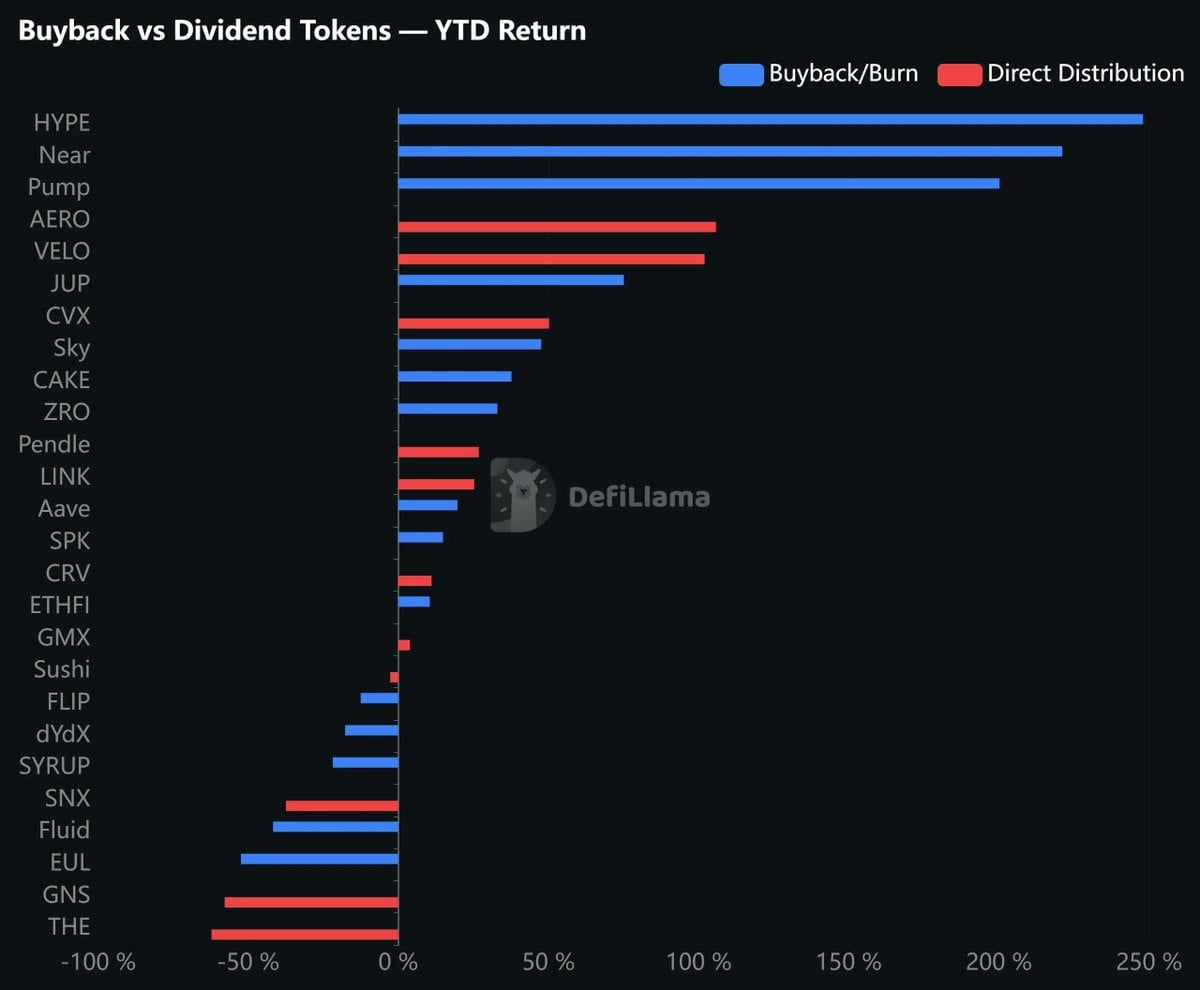
A different comparison, attributed in the source to a September 2026 DefiLlama analysis, put median year-to-date returns at 19.7% for buyback tokens versus 11.1% for tokens with direct distributions. The source also reports market-cap-weighted returns of 190% and 29%, respectively. These results compare different sets of tokens and should not be read as a controlled test of the two mechanisms.
How the mechanisms differ in practice
- WLFI: World Liberty Financial had already launched WLFI buybacks by the November 13 reporting date, using part of USD1 reserve-related income. The source put that income’s annualized level above $150 million. The relevant question is how much of it actually funds purchases as USD1 activity changes—not whether reserve income itself belongs to WLFI holders.
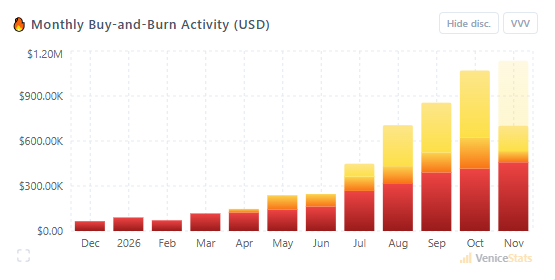
- VVV: Venice combined discretionary burns with automatic burns linked to new subscriptions and API-credit purchases. The source reported approximately $458,000 worth of VVV removed from circulation in its November 9 discretionary burn and approximately $1.07 million burned during October. These figures describe token removal, rather than a directly comparable open-market buyback budget.
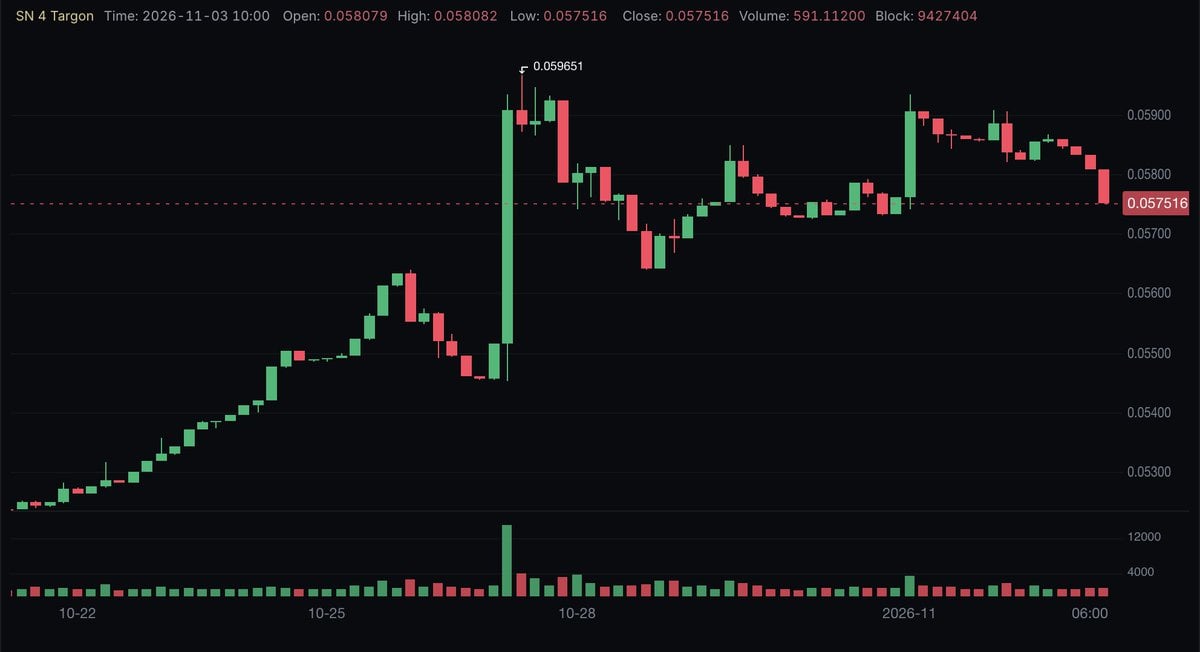
- Bittensor subnet Alpha tokens: Subnet incentives include TAO emissions, making token demand and emissions management part of the comparison. Citing SubConnect’s index as of August 2026, the source said 14 of 24 externally revenue-generating subnets used that revenue for Alpha-token buybacks. It also reported that Targon announced an approximately $2.1 million Alpha-token burn on October 27, including about $445,000 in newly repurchased tokens funded by its AI-compute business revenue.
- LONG 500: Launched by long.xyz in September 2026, this design assigned 5% of tokenized-stock fees from new trading pairs to an $AI community treasury for tokenized-stock accumulation and another 5% to buying and burning the paired community token. Treasury asset accumulation and community-token supply reduction are separate effects; neither is the same mechanism as buying back a single protocol’s native token.
The practical distinction is therefore not simply buyback versus no buyback. Compare the source of funds, the amount of incoming supply, the treatment of purchased tokens and the competing uses of revenue. The reported returns provide context for those questions, not a promise of future token performance.
Source: techflowpost.com (originally published 2026-11-13 16:37 UTC+8)